Running the business
Technician performance
The repairs report breaks down by technician: how many jobs each completed, the revenue attached to them, and average turnaround time. It filters by date range and branch, and is visible to admins and managers.
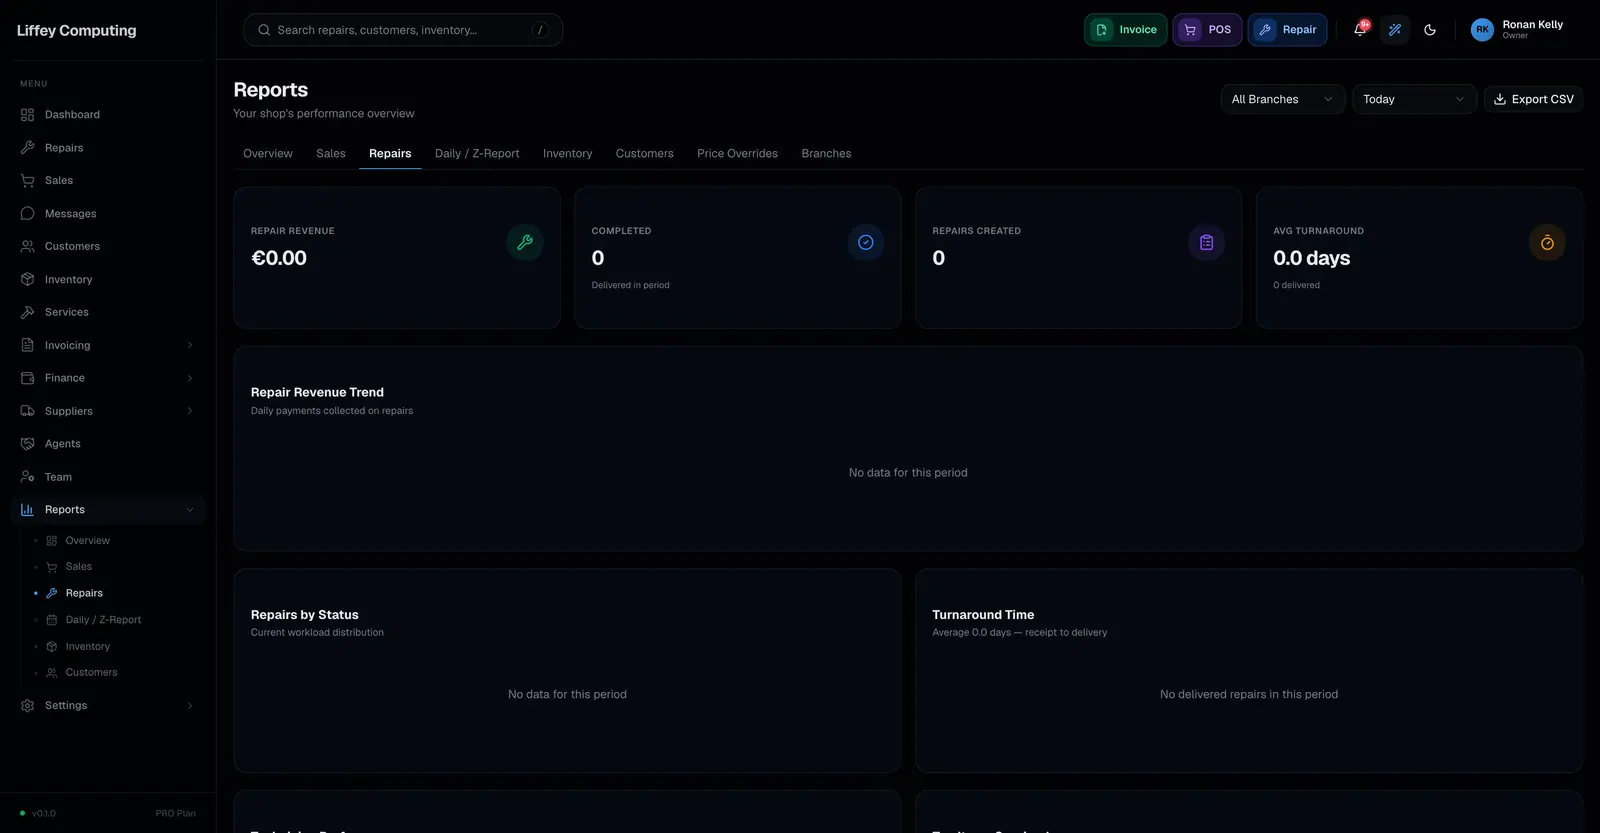
What it does
Turnaround is the thing customers judge a repair shop on, and it is almost never measured.
Because every stage change is recorded with a time, the gap between Received and Delivered is known for every job rather than estimated.
Grouped by technician, that shows who is fast, who is carrying the most work, and where jobs are sitting.
Revenue per technician sits alongside it, because volume and value are different questions.
This is visible to admins and managers. A technician does not see their colleagues' figures.
Every capability
| Jobs completed | Per technician, over a date range |
|---|---|
| Revenue | Attached to the jobs they completed |
| Turnaround | Average time from intake to delivery |
| Source | Stage change timestamps, not estimates |
| Filters | Date range and branch |
| Visible to | Admins and managers |
Questions
Where does turnaround time come from?
From the recorded stage changes on each repair, so it is measured rather than estimated.
Can technicians see each other's numbers?
No. The report is for admins and managers.